

Data Explorer
Data Explorer app process of analyzing volumes of data to find patterns, discover trends, and gain insight into how that data can be used to make decisions or predict an outcome.
Skills and deliverables
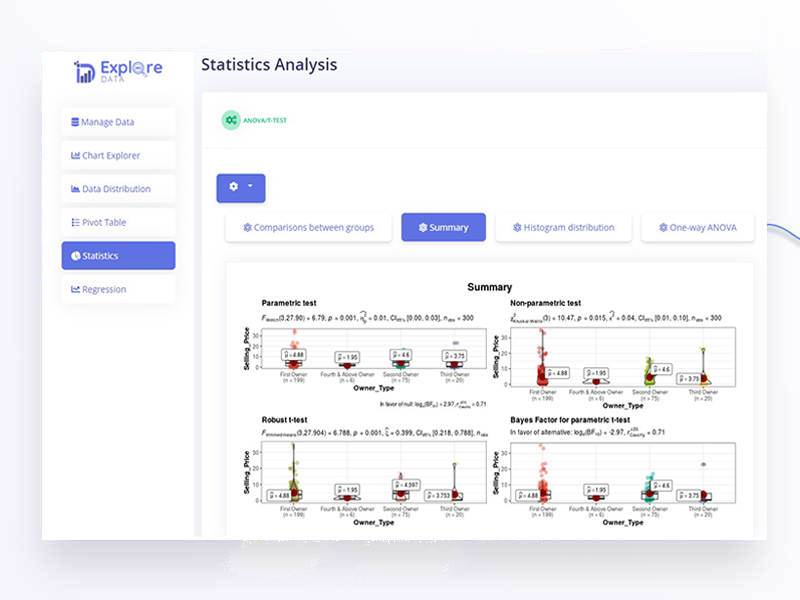
Exploratory Data Analysis, Statistics, Regression, Pivot Table, Chart
Challenge
Data analysts face numerous challenges during data exploratory analysis. One of the primary obstacles is dealing with data quality issues, as incomplete or inaccurate data can lead to unreliable results. Preprocessing data, handling large and diverse datasets, and integrating multiple data sources can be time-consuming and complex. Creating informative visualizations and managing uncertainty are additional challenges. Moreover, working with big data demands advanced processing techniques and tools.
Solution
To overcome these challenges, data analysts must possess a strong foundation in data analysis techniques, data manipulation, and visualization skills. Utilizing advanced analytics tools and technologies can enhance the efficiency of data exploration and improve decision-making based on the insights gained from the analysis.
Objectives
Exploratory Data Analysis offers the benefits of enhancing data understanding, discovering insights and patterns, facilitating data cleaning and preprocessing, supporting feature selection, hypothesis generation, enabling effective visualization, and driving data-driven decision making.
Features:
- Data Understanding: EDA helps researchers and analysts become familiar with the dataset, its structure, and variables. It aims to understand the nature and content of the data, including its distribution, range, and any potential data quality issues.
- Data Cleaning and Preprocessing: EDA aims to identify and address data quality issues such as missing values, outliers, or inconsistencies. By cleaning and preprocessing the data, EDA ensures that the subsequent analysis is based on reliable and accurate data.
- Pattern Identification: EDA aims to detect meaningful patterns, trends, and relationships within the data. It explores variables and their interactions, enabling researchers to identify correlations, dependencies, or anomalies that can guide further analysis or hypothesis generation.
- Hypothesis Generation: EDA can help generate initial hypotheses or research questions based on observed patterns or relationships in the data. It serves as a starting point for formulating hypotheses to be tested through more formal statistical methods or modeling techniques.
- Feature Selection: EDA aims to identify the most relevant features or variables that have a significant impact on the target variable or outcome of interest. By selecting informative features, EDA assists in reducing dimensionality and improving the efficiency and effectiveness of subsequent modeling or analysis.
- Data Visualization: EDA aims to visually represent the data through charts, plots, graphs, or other visualizations. Visualization techniques help in presenting complex information in a more intuitive and understandable manner, facilitating data-driven insights and decision-making.